
Chapter 5.4: Leftern Madness and the Doppelgänger
So... sitting around viewing the graphs of many many Collatz Worlds in this new x-axis logarithm form, I began to discover certain patterns. The first of which is the Tiling phenomenon (which we already just talked about). But there were two more interesting observations I found worth noting.
The Leftern Madness
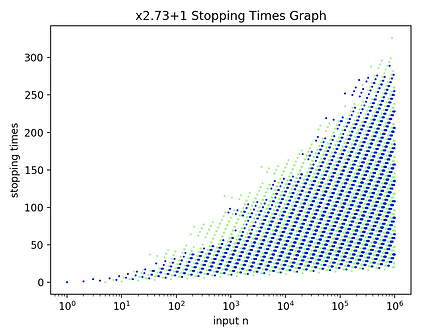
Let's take a Collatz World, some random one like maybe x3+17, and examine its Stopping Times Graph. In particular, let's look a little farther out than we usually do. Maybe out to n=1,000,000 instead of 10,000. We talked last time about how if you go far enough out to the right and zoom in, the image begins to "tile" and exhibit (at least visually) a strong periodic behavior. Let us now instead consider looking at the left side of this image.
If you start in the "controlled" and more "sane" right side of the image and drift your eyes from the right to the left, it's almost like watching the threads of a knitted carpet become unwoven. What before was all meshed together untangles and separates into disassociated strands of color. The inherent "logic" of the right side of the graph wanes and disintegrates the farther to the left you look. Look far enough to the left and the image becomes pure incomprehensible chaos, almost as if blown upon by the "winds of madness" as a poet might say.
I'll place just a few images here as demonstration. In the bottom two images, note that the speed and ferocity of the winds of madness seem to be greater the higher the value of a you choose in xa+b.

The Doppelgänger Phenomenon
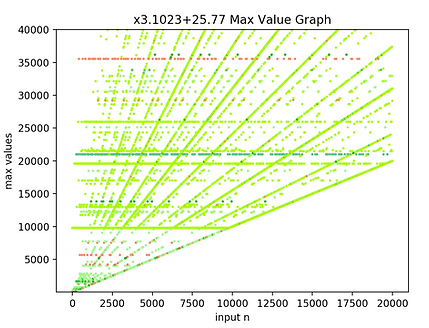
Where all of the above is about patterns within the Stopping Times Graphs, let's now examine one of the Max Value Graphs. Let's (arbitrarily) take the x3.1023+25.77 world. On the left is the Max Value Graph regular-style. On the right is the same graph but with logarithmic x-axis.

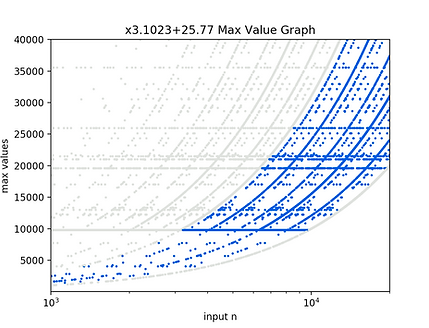
Now within the image on the right let's zoom in a little on just the righthand side of the image.
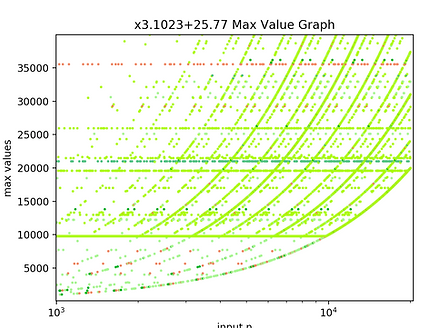
Within this image (all the x-axis logged Max Value Graphs look a lot like this) there is always the following very cool pattern that I've discovered!... So you see how in the above picture there is a lot of what looks like semi-repetitive activity as you go from left to right? This might not seem obvious at first at all, but it's got a hidden secret to it. It's way more than semi-repetitive! Watch this! I'm going to take two chunks and highlight them separately.

It's easiest to explain the Doppelgänger phenomenon with a video:

