
Chapter 4.3:
Video Paths through the Collatz A-B Plane
So... up until now we have now many times taken a given Collatz world xa+b and examined that world a little closer by looking at its Stopping Times and Max Value Graphs. Consider "driving" along the path from x0+1 to x6+1. Here are some quick random snapshots of what you would see along the way.


But what would happen if we had the audacity to take all of these images, all of the Stopping Times Graphs and Max Value Graphs from x0+1 all the way up to x6+1, and link them together successively one after and make a video out of them? We would get what I like to a call a Video Path through the Collatz A-B Plane! Effectively this would let us "drive a little spacecraft" from one location in the A-B Plane to another.... and look out the window as we went!
Let's give it a shot. I'll present to you the two videos separately. On the left is the Stopping Times Graphs video, on the right is the Max Value Graphs video. Take a look at them, they're wild! We'll discuss what we're looking at down below.
The Stopping Times Graphs Video:
• Near x0+1 -- It starts out innocently enough. It begins all gray, corresponding to one single loop at n=0. It seems controlled, if a little chaotic.
• Near x1+1 -- At x1 there is a major bifurcation! It suddenly turns all blue, as we now have a solitary loop at n=1. We see the fascinating horizontal bands structures and (totally surprisingly!) watch them flow steadily from right to left!
• Near x1.6+1 -- We see that the bottom of the image seems more stable while the top dances like static. More colors (purple) start to appear at x1.6 something. Then slowly more and more.
• Near x2+1 -- At x2 something wild happens! More and more colors appear and the stopping times bands sort of all come together into little vertical towers which then race off screen to the right. Totally wild!...
• Near x2.15+1 -- Things have calmed down again into a more familiar-looking Collatz image.
• Near x2.378+1 -- Sometimes a whole lot of "dust" will seem to momentarily appear on the bottom of the image, of many many colors. A fine example of this is at x2.378+1. What's so cool is that these correspond to the strange little pyramids we were looking at earlier! Recall that the strange little pyramids were a crescendoing and then diminishing occurrence of way more different loops than found in the surrounding Collatz worlds. Those different loops are indicated on these graphs with various
colors. In this video we can finally "see" what those strange little pyramids look like. They are the super-colorful "dust" that comes and goes on the bottom of the video now and then. If you look carefully at the lead-up to x2.378 (and the departure from it afterwards), you can see that the strange little pyramid seems to occur exactly as the stopping times bands line up vertically / pass over one another in the video. Other times though they do seem to come and go more randomly. (We'll talk about this more later.)
• Near x2.7+1 -- I personally love watching the little stopping times bands drift gently to the left.
• Near x2.828+1 -- There is a particularly intense strange little pyramid at x2.828+1.
• Near x3.000+1 -- And out of nowhere right in the middle of it all, like it's no big deal, lies the famous x3+1 Collatz World. It's so interesting seeing it as part of this smooth flowing continuum of other nearby Collatz Worlds.
• Near x3.5+1 -- The drama and frenetic chaos continues.
• Near x4+1 -- We see another fascinating sort of "explosion", if you will, at x4+1 similar to the one at x2+1.
• Near x5+1 -- By x5+1 we are now encountering so much divergence in these landscapes that the video begins to visually appear more and more sparse.
• Near x6+1 -- You can see it plain as day; by x6+1 some of these worlds appear to be all divergent.
The Max Value Graphs Video:
• Near x0+1 -- This video also begins all gray. Things are pretty chill from x0+1 to x1+1.
• Near x1+1 -- Just like with the Stopping Times video there is a massive bifurcation at x1+1. The colors switch from gray to blue as the loop_seed changes from n=0 to n=1.
• Near x1.2+1 -- So the image seems rock solid and stable at this juncture. What exactly are we seeing here? It seems to be two diagonal lines, slowly extending apart from one another. If you think about it though, this actually kind of makes sense. If you place in a number which is even, it falls by ÷2. If you place in a number which is odd, it rises by x1.?+1 .. which then falls by ÷2... (and here's the important part) giving a value which is less than where we started. This means that the hailstones, no matter the specifics of their route, are steadily falling with no ambiguity. A given input, if even, will never again reach that high. These are the lower diagonal line. And meanwhile a given input, if odd, will go up by x1.?+1 once, reach its maximum value, and then never again reach that high. These are the upper diagonal line.
• Near x1.7+1 -- At around x1.7 we see the introduction of more colors. Then more. Then more. The colors seem to be moving along the line, although it's difficult to determine exactly which direction they are flowing in. After a little while there suddenly are lots of colors, like wildly so.
• Near x2+1 -- At x2 there is the craziest bifurcation I've ever seen. It's WILD! Honestly, I'm not even going to try and explain this thing. Take a look at it for yourself. I sometimes can't even believe that this crazy looking "Big Bang" kind of phenomenon is the origin / the birthplace of the famous Max Value Graph. That's how it starts!
• Near x2.5+1 -- As the video continues, we see that some of the diagonal lines seem to stay stationary while others gently move behind them like fan blades.
• Near x2.828+1 -- At x2.828 we spot something really weird. All of the little horizontal lines seem to, for no known reason, briefly race off to infinity... and then return just as quickly. It's very odd. Yet more mysteries of Collatz Space. Note that this the same x2.828+1 location as the particularly massive strange little pyramid we observed earlier in the xa+1 Loop_Seeds Graph.
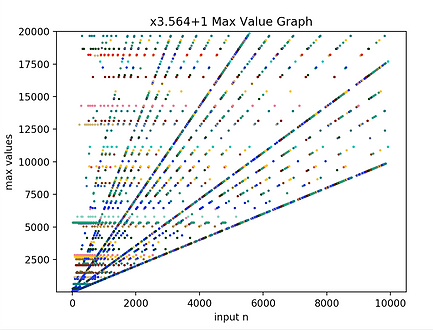
• Near x3+1 -- Just like with the Stopping Times Video, it's fascinating to see the famous x3+1 Max Value Graph just plopped casually in the middle of this video... finally seen with all its other "family members", if you will.
• Near x3.245+1 -- Once again we see all the little horizontal lines race off to infinity before coming back. So odd...
• Near x4+1 -- Now we see, perhaps starting as early as at x3.5+1, the entire graph moving gracefully and slowly towards infinity and then, after x4+1, returning just as gracefully. Since x4+1 is an example of a massive pyramid on the Loop_Seeds Graph, perhaps this can give us insight into what we were seeing earlier at x2.828+1 and at x3.245+1.
• Near x4.416+1 -- This video ends just a little bit earlier than the other one. Perhaps I will go back and extend it to x6 in the days / weeks to come.
I myself found these images / videos very interesting and artistically pleasing. The landscapes of the Collatz Wilderness really are gorgeous.